Precision. Communication. Transparency.


TIMBERLAND

Over the long-term, we believe Timberland provides enhanced portfolio diversification with returns that have been far less volatile than most assets, therefore producing high relative risk-adjusted returns.

Timberland returns are driven primarily by the biological growth of trees, which is unaffected by the economy. This unique feature sets timberland apart from other asset classes. Consequently, timberland’s return generating process is largely independent of the factors that provide returns from equities and fixed income. As a result, the correlation of timberland returns with more traditional asset classes is not statistically different from zero.

Domain employs a well-defined, active timberland investment strategy, focused on the acquisition, management and disposition of properties, which typically meet a certain set of criteria, including:

Smaller, non-contiguous properties, generally within the 2,000 to 30,000 acre size range.
Significant biological growth and income potential.
Diversified by geography, botanical species and age to reduce risk and enhance liquidity.
Potential for value creation from an active, opportunistic and sustainable management regime.
Investments in markets with strong or growing demand.

Risk-Adjusted Returns

Over the long-term, Timberland provides enhanced portfolio diversification with returns that have been far less volatile than most assets, therefore producing relative risk-adjusted returns.

Returns for various asset classes (2006–2022)

From 2006 through 2022, the NCREIF Timberland Property Index, with a standard deviation of 5.7%, was substantially less volatile than the 17.6% and 18.6% experienced by the S&P 500 and Russell 2000, respectively

U.S. Timberland’s risk-adjusted performance, as measured by the Sharpe Ratio1, was 0.58, versus 0.36 for the S&P 500.

Natural Inflation Hedge

Returns aren’t the only attraction. Timberlands’ intrinsic and proven long-term ability to preserve capital by historically tracking the consumer-price index, can serve as an effective inflation hedge.

Timberland Correlation vs Inflation

Timberland has historically maintained a positive correlation with unanticipated spikes in inflation. During periods of high inflation, as in the 1970s, timberland provided a partial inflation hedge by producing a correlation coefficient of 0.34 through the decade. More recently, U.S. timberland followed inflation with a correlation of 0.93 from 2018 through 2022. In most cases, timber prices rise with inflation and account for a larger proportion of timberland returns than would otherwise be expected.

During periods of disinflation or low inflation, timberland’s annual correlation to CPI typically declines or becomes negative. Biological growth, as a physical process that is entirely unrelated to economics, accounts for a higher proportion of timberland returns during a low inflation environment.

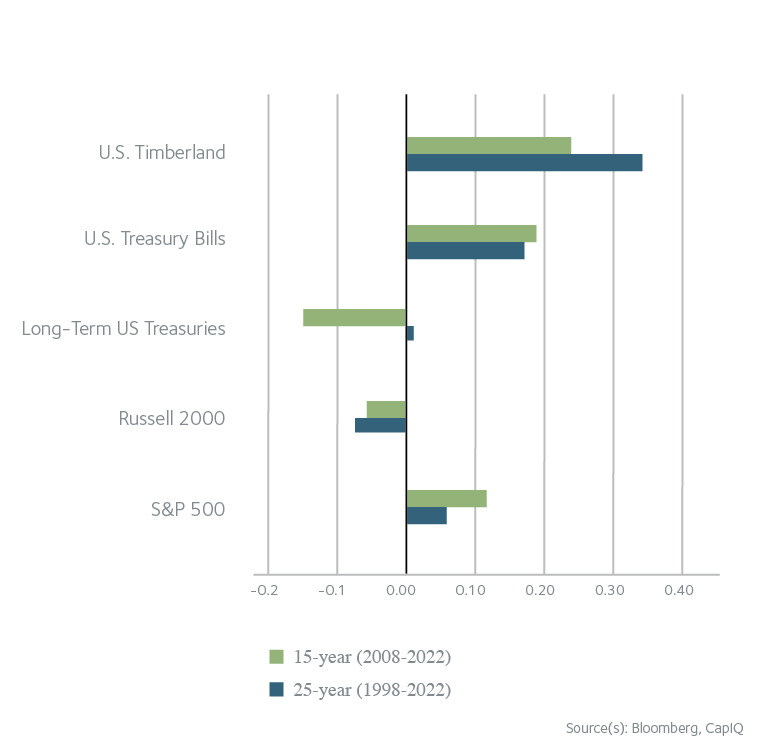
However, timberland’s inflation hedging potential becomes most evident when applied to longer investment periods which are typical for the asset class. As an example, rolling 10-year returns for U.S. timberland investments from 1997 to 2022 had a high correlation (0.85) to changes in average annual inflation over those same 10-year periods. Increasing the investment period only tightens the relationship. For comparison, the S&P 500 and Russell 2000 produced correlation coefficients of 0.11 and 0.30 relative to inflation over the same period of rolling 10-year returns.

Low Correlation

Low Correlation with Most Other Asset Classes

TIMBERLAND CORRELATION VS OTHER ASSET CLASSES

A significant portion of timberland returns are driven by the biological growth of trees. Considering this value driver operates independently and is not effected by the factors that drive public equity and fixed income markets, timberland returns remain relatively uncorrelated with most common asset classes on an annual basis.

Downside Protection

Biological Growth Element Reduces Risk

Biological tree growth, which is unaffected by the economy and invariable positive, is a unique feature that sets timberland apart from other asset classes.

Biological growth has a compounding effect in both volume and value. First, biological growth provides increasing total volume of wood. Trees, on average, can be expected to grow in volume approximately 2-8% per year, depending on location. Secondly, as diameter increases, the trees become more valuable, with large diameter trees being more valuable than smaller ones.

Biological Yield Curve

Growth Sectors PreMerch
Age (years) 0 - 10
Growth Rate 12%+
Income Yield N/A
Products None
Minerals Oil, Gas, Brine, Coal, Sand, Iron Ore, etc
Other Hunting and Recreational Leases, Pine Straw, Maple Sugar, etc.
Growth Sectors Pulpwood
Age (years) 11 - 15
Growth Rate 8 - 12%+
Income Yield Moderate
Products Paper, Particle Board, Wafer Board, Diaper Fill, Chemicals
Minerals Oil, Gas, Brine, Coal, Sand, Iron Ore, etc
Other Hunting and Recreational Leases, Pine Straw, Maple Sugar, etc.
Growth Sectors Chip-N-Saw
Age (years) 16 - 22
Growth Rate 6 - 9%+
Income Yield Moderate
Products Dimensional Lumber:
1x4s, 2x4s, 4x4s, etc.
Pulpwood Products
Minerals Oil, Gas, Brine, Coal, Sand, Iron Ore, etc
Other Hunting and Recreational Leases, Pine Straw, Maple Sugar, etc.
Growth Sectors Sawtimber
Age (years) 23+
Growth Rate 3 - 6%
Income Yield High
Products Dimensional Lumber:
2x6s, 2x8s, 2x10s, 2x12s, etc.
Plywood Products
Minerals Oil, Gas, Brine, Coal, Sand, Iron Ore, etc
Other Hunting and Recreational Leases, Pine Straw, Maple Sugar, etc.
Growth Sectors Prime
Age (years) 23+
Growth Rate 3 - 4%
Income Yield High
Products Telephone Poles, Wide Boards
Minerals Oil, Gas, Brine, Coal, Sand, Iron Ore, etc
Other Hunting and Recreational Leases, Pine Straw, Maple Sugar, etc.
Biological Yield Curve
Growth Sectors PreMerchPulpwoodChip-N-SawSawtimberPrime
Age (years) 0 - 1011 - 1516 - 2223+23+
Growth Rate 12%+8 - 12%+6 - 9%+3 - 6%3 - 4%
Income Yield N/AModerateModerateHighHigh
Products NonePaper, Particle Board, Wafer Board, Diaper Fill, ChemicalsDimensional Lumber:
1x4s, 2x4s, 4x4s, etc.
Pulpwood Products
Dimensional Lumber:
2x6s, 2x8s, 2x10s, 2x12s, etc.
Plywood Products
Telephone Poles, Wide Boards
Minerals Oil, Gas, Brine, Coal, Sand, Iron Ore, etc
Other Hunting and Recreational Leases, Pine Straw, Maple Sugar, etc.